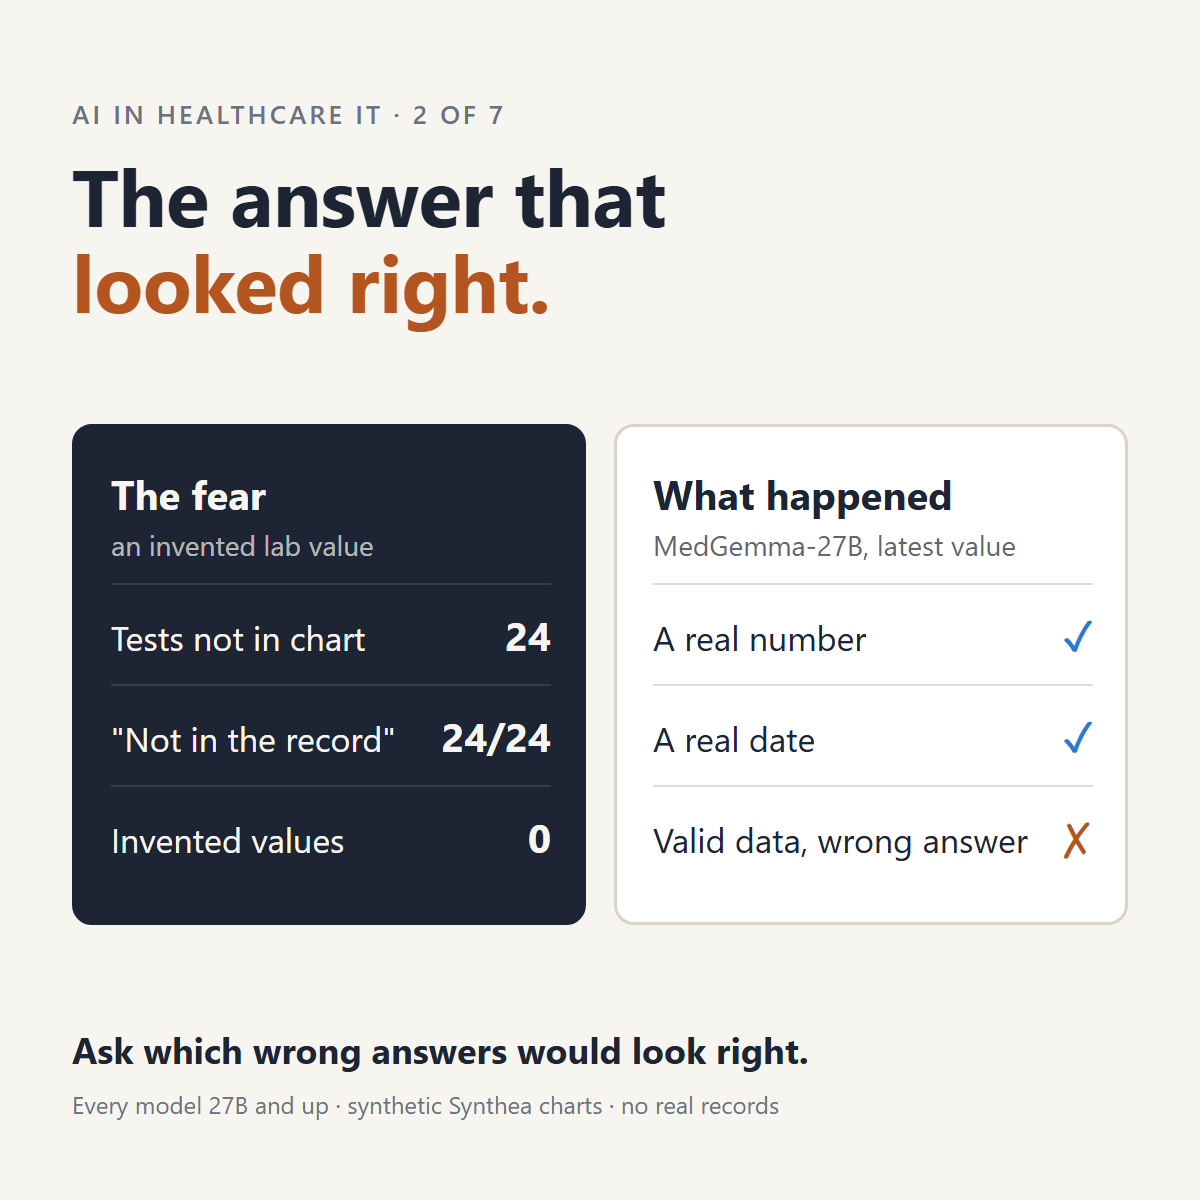
When people worry about AI in healthcare, they usually mean hallucination: a model inventing a lab value that was never drawn. It’s the right thing to worry about first, because a fabricated value looks exactly like a real one.
So I measured it directly. In the first post I described the test: 12 synthetic patients from Synthea, 163 questions about their charts, every answer computed from the data. The questions fall into seven categories: visit counts, current medications, stopped medications, diagnosis dates, the latest value of a lab or vital sign, a lab’s trend over time, and things that aren’t in the chart at all. Each category has 24 questions (19 for diagnosis dates) and gets its own score. The last one is the hallucination test. Its 24 questions ask about a lab test the chart doesn’t have, and the only right answer is “not in the record.”
Every model 27B and up got all 24 right, with zero invented values. The smallest model I tested, MedGemma-4B, got 23 and invented one.
I’m grateful for that. A model that declines when the answer isn’t there is something you can build a product on. But the problem that worried me turned up somewhere else.
A real value from the wrong date
MedGemma-27B, Google’s medical fine-tune of Gemma 3, made a different mistake, on questions that needed the most recent value of a lab or vital sign.
In all seven of its latest-value errors — two direct “latest lab” questions, and five where it had to report the last value in a lab trend — it gave an earlier result, not an invented one. Asked for the first and most recent eGFR, a kidney-function test, in one synthetic patient’s chart, it gave the most recent as 92.4, a real result from a checkup on June 23, 2026. The latest result, from a follow-up visit a week later on June 30, was 68.1. The other misses had the same shape: a visit one to fifteen days before the real latest one, or the previous year’s checkup instead of this year’s.
A real number. A real date. The right units, the right format. Nothing about it looks wrong to the person reading it, and it would pass most automated checks too: a range check, a format check, even a check that the value actually appears in the chart — because it does.
It wasn’t a long-chart problem, either. It happened on a 3,400-token chart, one of the shorter ones in the set.
On a “most recent value” question, the date is the answer. A stale value presented as current is exactly the error a busy reader has no reason to question.
Before blaming the model
My first suspect was my own setup, and for a specific reason. Gemma 3 interleaves two types of attention: five local layers, which only look at a nearby window of text, for every global layer that sees the whole input (Gemma 3 Technical Report). I was splitting the model across two GPUs (a pair of 24 GB Tesla P40s, 48 GB of VRAM between them) with a llama.cpp mode that was new at the time. A bug in how attention is masked near the end of the input could plausibly produce this exact pattern — an earlier entry read in place of the last one.
So I tested the stack before making any claim about the model:
- A different GPU split. I re-ran the seven questions with the model split across the cards by layers instead of by tensors. Same latest value and date on all seven, both ways. Those reruns also showed me that one of the seven is borderline: a systolic blood pressure the main run got wrong (135 from December 2024, not 121 from December 2025) came back right whenever llama.cpp read that chart fresh instead of reusing its cached copy from an earlier question. The other six came back every way I ran them.
- The base model. I ran Gemma 3 27B — the general model MedGemma is built from — on the same llama.cpp build, with the same settings, on the full test. It never once reported an earlier value as the latest. Its four misses on “latest lab” all had the right value with the wrong date, and it got the last value right in all 24 lab trends. MedGemma, in that same side-by-side run, gave an earlier value as the latest four times.
- Repeatability. The pipeline is deterministic: MedGemma-27B, run three times on one of my test sets, gave byte-identical answers all three times. These errors aren’t random noise. Run the same way, they come back every time.
The numbers are small, but the split was clean. Same engine, same settings, same charts: the base model didn’t have the habit, and the medical version did.
The base-model control made a llama.cpp problem unlikely, since both models go through the same code. But before calling this a property of the model rather than of my build of it, I wanted a second inference engine entirely. So I downloaded Google’s own MedGemma-27B weights at full precision, with no quantization, and ran the seven questions through Hugging Face Transformers instead of llama.cpp. It gave the same wrong value and date as my main run on all seven, the borderline blood pressure included. A different engine and a different number format, with no quantization, showed the same habit.
Setting that up turned up a fault in my own box, which is the point of checking. The two GPUs couldn’t copy data directly to each other. The system’s memory protection (the IOMMU) was on, and NVIDIA documents that its Linux driver doesn’t support direct GPU-to-GPU copies in that mode. What arrived was silently corrupted. llama.cpp’s answers showed no sign of it, but the second engine hung on its first question until I routed those copies through system memory. NVIDIA’s fix is to turn that protection off for the GPUs, which takes a reboot; for this test, the detour was enough.
So I describe this as a habit of MedGemma-27B on most-recent-value questions. It held across two runtimes, on synthetic charts, and it isn’t a verdict on MedGemma for the jobs it was built for.
Fine-tuning adds habits, not just knowledge
Against its own base model, MedGemma’s medical training moved the overall chart-lookup score up about 4 points. On the error-spotting test I’ll cover in a later post, it moved it by about zero. And it added a habit the base model didn’t have.
That’s the trap in a single overall score. A +4 average looks like an upgrade. Inside it was a new failure mode, on exactly the questions where a wrong answer looks right. A team that only read the headline number would ship the habit along with the improvement.
Right some percentage of the time
A deterministic system is either right or it has a bug. A model is right some percentage of the time, and that percentage changes from one type of question to the next. Here’s the percent each configuration got right on the chart-lookup test, one column per category:
| Configuration | Not in record | Visit count | Current meds | Diagnosis date | Lab trend | Latest lab | Stopped meds | All 163 |
|---|---|---|---|---|---|---|---|---|
| Qwen3-27B Q8, thinking | 100% | 83% | 71% | 100% | 96% | 100% | 100% | 93% |
| HuatuoGPT-3 27B, thinking | 100% | 83% | 75% | 100% | 92% | 100% | 100% | 93% |
| Qwen3-27B Q4, no thinking | 100% | 71% | 58% | 100% | 67% | 100% | 100% | 85% |
| Qwen3-27B Q8, no thinking | 100% | 71% | 58% | 100% | 62% | 100% | 100% | 84% |
| Qwen3 MoE 35B-A3B | 100% | 62% | 58% | 95% | 46% | 100% | 100% | 80% |
| Baichuan-M2 32B, thinking | 100% | 50% | 46% | 100% | 54% | 83% | 96% | 75% |
| Llama 3.3 70B Q4 | 100% | 54% | 58% | 100% | 17% | 100% | 79% | 72% |
| MedGemma 27B | 100% | 50% | 54% | 100% | 25% | 92% | 71% | 69% |
| Gemma 3 27B (base) | 100% | 42% | 54% | 95% | 8% | 83% | 79% | 65% |
| MedGemma 4B Q8 | 96% | 50% | 42% | 53% | 0% | 21% | 62% | 46% |
Percent of questions answered correctly: 24 questions in each column (19 for diagnosis date). “All 163” is the share of all 163 questions answered correctly, not an average of the columns, though with the columns so close in size the two land within about a point. Six of the 24 current-medication questions are affected by a quirk in my own answer key — next week’s post — so read that column as a floor.
Almost every model is perfect on “not in the record” and diagnosis dates. The spread is in visit counts, current medications and lab trends, and an overall score blends all of that into one number. A model can be flawless at declining to answer and still be the wrong choice for the questions your users actually ask.
Two honest options
So the product has to make a choice for each category:
- Show it, with a confidence signal the client can understand, so they know how much to trust it.
- Or don’t show it at all until the model’s accuracy in that category clears a threshold.
I priced the first option with a follow-up run. After every answer, I asked the model how likely it was that the answer was correct, from 0 to 100. That signal was useless: across six runs (three configurations on two test sets), 856 of 880 answers were rated 100, including 57 of the 63 wrong ones. The token probabilities the model’s own server computes were a different story. For Qwen3-27B without thinking on the chart-lookup test, holding back its least-sure fifth of answers would have caught 18 of its 26 errors and lifted the answers it showed from 84% to 94% right. On the error-spotting test the signal was weak: it would have caught 1 of 5 errors, though five is too few to judge. So a confidence signal can work, but it has to come from the machinery rather than from asking the model, and it has to be tested on records like the ones you’ll actually see.
The second option I could price from the answers I already had. The rule: show the model’s answers in a category, say visit counts, only if its accuracy there is at or above a cutoff, and hide the rest. To keep the data from grading itself, I set the cutoff using 11 patients and applied it to the 12th, rotating through all 12. (The results barely moved compared with setting it on everyone.)
| Configuration | Show everything | 90% cutoff: shown / accurate | 95% cutoff: shown / accurate |
|---|---|---|---|
| Qwen3-27B Q8, thinking | 93% | 72% / 97% | 71% / 99% |
| HuatuoGPT-3 27B, thinking | 93% | 72% / 97% | 58% / 98% |
| Qwen3-27B, no thinking | 84% | 56% / 100% | 56% / 100% |
| Qwen3 MoE 35B-A3B | 80% | 56% / 99% | 45% / 99% |
| Baichuan-M2 32B | 75% | 41% / 99% | 41% / 99% |
| Llama 3.3 70B | 72% | 41% / 100% | 41% / 100% |
| MedGemma 27B | 69% | 41% / 97% | 29% / 96% |
| Gemma 3 27B (base) | 65% | 28% / 93% | 16% / 96% |
| MedGemma 4B | 46% | 15% / 96% | 15% / 96% |
Withholding gets almost every model to 96–100% on what it shows. The difference between models stops being accuracy and becomes coverage: how much each one lets you show. The best configuration answered 71% of questions, 99% of them correctly. Llama 3.3 70B hit 100%, but answered only 41%.
Technically, Llama ties for the most accurate model in that table. It may not be useful enough to ship.
Settle the score before the test
I’m not close enough to product development to say how accuracy and coverage should be weighed for a given product, and I don’t think engineering should be the one to decide it. But it’s the first thing I’d want settled, before any model is tested:
- For each question category, the minimum accuracy for its answers to be shown at all.
- For the feature as a whole, the minimum coverage for it to be worth building. A lookup assistant that declines most questions might be perfectly safe and still not worth a client’s time.
- One combined score built from those two, so every model is judged on what the product needs, not on whichever number happens to look best.
Settle those after the results are in, and it’s too easy to draw the line wherever the favorite model happens to land.
Both options are legitimate. What isn’t legitimate is shipping every answer with the same confident formatting and letting the client find out which ones were weak.
One caveat on my own numbers: each column in that table rests on only 19 to 24 questions, from 12 patients. Small samples are noisy. Say a model got 18 of the 24 questions in one category right: that’s 75%, but on a much bigger test the same model could plausibly land anywhere from about 55% to 88%. Even a perfect 24 out of 24 doesn’t prove the model is perfect there. It only tells you it’s probably right at least 86% of the time. So the 90% and 95% cutoffs above are finer than this test can measure, and a real product would need a much bigger test set before relying on them. The method is the point here, not the exact cutoffs.
How I’d coach a team through this
- Report errors for each type of question, not one overall score. A good average can hide a bad category, and a fine-tune can improve the average while adding a new failure.
- Ask which wrong answers would look right. Those set the threshold, not the average. Safety engineers call this detectability: in a failure mode and effects analysis (FMEA), a failure that’s hard to spot ranks as riskier than an equally bad one that’s obvious. A model that says “not in the record” is easier to live with than one that’s occasionally, plausibly, out of date.
- Engineering measures; product and clinical people decide where the line is. Engineers trained on pass/fail systems often want to make that call alone. It isn’t theirs — and, as I said above, it isn’t mine either.
- Rule out your own infrastructure before you make a claim about someone else’s model. Test the split, the runtime and the base model. It’s cheap, and it’s the difference between a finding and an accusation.
How I ran this
The full method — the data, the question categories, the ten configurations and the cross-checks — is in the first write-up. The parts specific to this post:
- The latest-value questions. “Latest lab” asks for the most recent value and date of a named measurement: a lab such as eGFR, glucose or triglycerides, or a vital sign such as blood pressure or BMI. “Lab trend” asks how many results one has, when the first was, and what the last value was and when. Every answer was computed from the Synthea data and graded exactly, at temperature 0 with a fixed seed.
- The GPU-split check. MedGemma-27B’s seven latest-value questions, re-run under llama.cpp with the model split by layer and then by tensor across the two cards. Same latest value and date on all seven both ways; one result count differed (11 vs 10).
- The second-engine check. Google’s MedGemma-27B text weights from Hugging Face (revision
5b667cf), unquantized bf16, under Hugging Face Transformers with greedy decoding. The prompts were the seven questions, scored by the same script. The answers matched the main llama.cpp run’s latest value and date on all seven. The long charts went in as 2,048-token pieces to fit in memory; re-asking two questions both ways gave identical answers. - The base-model control. Gemma 3 27B-it as a Q8 GGUF, on the same llama.cpp build with the same flags as MedGemma-27B, over the full chart-lookup and error-spotting sets.
- The withholding analysis. No new model runs: accuracy per category from the existing answers, a 90% and a 95% cutoff, chosen on 11 patients and checked on the 12th, rotated through all 12.
- The confidence check. Qwen3-27B Q8 with and without thinking, and HuatuoGPT-3 27B with thinking, on the chart-lookup and error-spotting sets. After each answer, a follow-up prompt asked for a whole number from 0 to 100 for how likely the answer was correct. Token probabilities came from a separate rerun of Qwen3-27B without thinking, with llama.cpp’s speculative decoding turned off: with it on, llama.cpp reports a real probability only for the first token of each reply. “Least-sure” ranks answers by the probability of the runner-up token inside the answer’s value.
- Margins of error. 95% Wilson score intervals for a proportion: 18 of 24 right (75%) gives 55–88%, and 24 of 24 gives 86–100%. With 19 questions (diagnosis date) they’re a little wider.
- Repeatability. Three runs of the same configuration at temperature 0 gave byte-identical answers, a 0.0% flip rate, so single-run results hold without averaging.
What this is not. Lookup on synthetic charts, graded exactly. One model’s habit on one test, checked on two runtimes, and not a verdict on MedGemma for the jobs it was built for.
This is part of a series I’m posting on LinkedIn — follow along there. Previously: The medical models didn’t win. Next week: my test had bugs too. Four of them.